Tuesday, October 29, 2013

FUK-U-SHIMA: 28 Signs That The U.S. West Coast Is Being Absolutely Fried With Nuclear Radiation From Fukushima - Map From The Nuclear Emergency Tracking Center Shows Elevated Levels Of Radiation Across The United States!

October 27, 2013 - UNITED STATES - The map below comes from the Nuclear Emergency Tracking Center. It shows that radiation levels at radiation monitoring stations all over the country are elevated. As you will notice, this is particularly true along the west coast of the United States. Every single day, 300 tons of radioactive water from Fukushima enters the Pacific Ocean. That means that the total amouont of radioactive material released from Fukushima is constantly increasing, and it is steadily building up in our food chain. Ultimately, all of this nuclear radiation will outlive all of us by a very wide margin. They are saying that it could take up to 40 years to clean up the Fukushima disaster, and meanwhile countless innocent people will develop cancer and other health problems as a result of exposure to high levels of nuclear radiation. We are talking about a nuclear disaster that is absolutely unprecedented, and it is constantly getting worse. The following are 28 signs that the west coast of North America is being absolutely fried with nuclear radiation from Fukushima…


1. Polar bears, seals and walruses along the Alaska coastline are suffering from fur loss and open sores… 

Wildlife experts are studying whether fur loss and open sores detected in nine polar bears in recent weeks is widespread and related to similar incidents among seals and walruses.

The bears were among 33 spotted near Barrow, Alaska, during routine survey work along the Arctic coastline. Tests showed they had “alopecia, or loss of fur, and other skin lesions,” the U.S. Geological Survey said in a statement.

2. There is an epidemic of sea lion deaths along the California coastline…
At island rookeries off the Southern California coast, 45 percent of the pups born in June have died, said Sharon Melin, a wildlife biologist for the National Marine Fisheries Service based in Seattle. Normally, less than one-third of the pups would die. It’s gotten so bad in the past two weeks that the National Oceanic and Atmospheric Administration declared an “unusual mortality event.”

3. Along the Pacific coast of Canada and the Alaska coastline, the population of sockeye salmon is at a historic low. Many are blaming Fukushima.

4. Something is causing fish all along the west coast of Canada to bleed from their gills, bellies and eyeballs.

5. A vast field of radioactive debris from Fukushima that is approximately the size of California has crossed the Pacific Ocean and is starting to collide with the west coast.

6. It is being projected that the radioactivity of coastal waters off the U.S. west coast could double over the next five to six years.

7. Experts have found very high levels of cesium-137 in plankton living in the waters of the Pacific Ocean between Hawaii and the west coast.

8. One test in California found that 15 out of 15 bluefin tuna were contaminated with radiation from Fukushima.

9. Back in 2012, the Vancouver Sun reported that cesium-137 was being found in a very high percentage of the fish that Japan was selling to Canada…

• 73 percent of mackerel tested
• 91 percent of the halibut
• 92 percent of the sardines
• 93 percent of the tuna and eel
• 94 percent of the cod and anchovies
• 100 percent of the carp, seaweed, shark and monkfish

10. Canadian authorities are finding extremely high levels of nuclear radiation in certain fish samples…
Some fish samples tested to date have had very high levels of radiation: one sea bass sample collected in July, for example, had 1,000 becquerels per kilogram of cesium.

11. Some experts believe that we could see very high levels of cancer along the west coast just from people eating contaminated fish

“Look at what’s going on now: They’re dumping huge amounts of radioactivity into the ocean — no one expected that in 2011,” Daniel Hirsch, a nuclear policy lecturer at the University of California-Santa Cruz, toldGlobal Security Newswire. “We could have large numbers of cancer from ingestion of fish.”

12. BBC News recently reported that radiation levels around Fukushima are “18 times higher” than previously believed.

13. An EU-funded study concluded that Fukushima released up to 210 quadrillion becquerels of cesium-137 into the atmosphere.

14. Atmospheric radiation from Fukushima reached the west coast of the United States within a few daysback in 2011.

15. At this point, 300 tons of contaminated water is pouring into the Pacific Ocean from Fukushima every single day.

16. A senior researcher of marine chemistry at the Japan Meteorological Agency’s Meteorological Research Institute says that “30 billion becquerels of radioactive cesium and 30 billion becquerels of radioactive strontium” are being released into the Pacific Ocean from Fukushima every single day.

17. According to Tepco, a total of somewhere between 20 trillion and 40 trillion becquerels of radioactive tritium have gotten into the Pacific Ocean since the Fukushima disaster first began.

18. According to a professor at Tokyo University, 3 gigabecquerels of cesium-137 are flowing into the port at Fukushima Daiichi every single day.

19. It has been estimated that up to 100 times as much nuclear radiation has been released into the ocean from Fukushima than was released during the entire Chernobyl disaster.

20. One recent study concluded that a very large plume of cesium-137 from the Fukushima disaster will start flowing into U.S. coastal waters early next year

Ocean simulations showed that the plume of radioactive cesium-137 released by the Fukushima disaster in 2011 could begin flowing into U.S. coastal waters starting in early 2014 and peak in 2016.

21. It is being projected that significant levels of cesium-137 will reach every corner of the Pacific Ocean by the year 2020.

22. It is being projected that the entire Pacific Ocean will soon “have cesium levels 5 to 10 times higher” than what we witnessed during the era of heavy atomic bomb testing in the Pacific many decades ago.

23. The immense amounts of nuclear radiation getting into the water in the Pacific Ocean has caused environmental activist Joe Martino to issue the following warning

“Your days of eating Pacific Ocean fish are over.”

24. The Iodine-131, Cesium-137 and Strontium-90 that are constantly coming from Fukushima are going to affect the health of those living the the northern hemisphere for a very, very long time. Just consider whatHarvey Wasserman had to say about this…

Iodine-131, for example, can be ingested into the thyroid, where it emits beta particles (electrons) that damage tissue. A plague of damaged thyroids has already been reported among as many as 40 percent of the children in the Fukushima area. That percentage can only go higher. In developing youngsters, it can stunt both physical and mental growth. Among adults it causes a very wide range of ancillary ailments, including cancer.

Cesium-137 from Fukushima has been found in fish caught as far away as California. It spreads throughout the body, but tends to accumulate in the muscles.

Strontium-90’s half-life is around 29 years. It mimics calcium and goes to our bones.

25. According to a recent Planet Infowars report, the California coastline is being transformed into “a dead zone”…

The California coastline is becoming like a dead zone.

If you haven’t been to a California beach lately, you probably don’t know that the rocks are unnaturally CLEAN – there’s hardly any kelp, barnacles, sea urchins, etc. anymore and the tide pools are similarly eerily devoid of crabs, snails and other scurrying signs of life… and especially as compared to 10 – 15 years ago when one was wise to wear tennis shoes on a trip to the beach in order to avoid cutting one’s feet on all the STUFF of life – broken shells, bones, glass, driftwood, etc.

There are also days when I am hard-pressed to find even a half dozen seagulls and/or terns on the county beach.

You can still find a few gulls trolling the picnic areas and some of the restaurants (with outdoor seating areas) for food, of course, but, when I think back to 10 – 15 years ago, the skies and ALL the beaches were literally filled with seagulls and the haunting sound of their cries both day and night…

NOW it’s unnaturally quiet.

26. A study conducted last year came to the conclusion that radiation from the Fukushima nuclear disaster could negatively affect human life along the west coast of North America from Mexico to Alaska “for decades”.

27. According to the Wall Street Journal, it is being projected that the cleanup of Fukushima could take up to 40 years to complete.

28. Yale Professor Charles Perrow is warning that if the cleanup of Fukushima is not handled with 100% precision that humanity could be threatened “for thousands of years“…

“Conditions in the unit 4 pool, 100 feet from the ground, are perilous, and if any two of the rods touch it could cause a nuclear reaction that would be uncontrollable. The radiation emitted from all these rods, if they are not continually cool and kept separate, would require the evacuation of surrounding areas including Tokyo. Because of the radiation at the site the 6,375 rods in the common storage pool could not be continuously cooled; they would fission and all of humanity will be threatened, for thousands of years.

Are you starting to understand why so many people are so deeply concerned about what is going on at Fukushima? - Scoop.

Monday, October 28, 2013

ICE AGE NOW: Chile Hit With Worst Cold Spell In 80 Years - State Of Emergency Declared In Its Agricultural Sector; 50 MILLION Boxes Of Fruit Damaged!

October 27, 2013 - CHILE - Anyone looking to get some delicious Chilean fruit this winter is going to be disappointed, as the worst frost in more than 80 years has damaged 50 million boxes of fruit exports — causing the country to declare a state of emergency in its agricultural sector.


The Chilean Fresh Fruit Exporters Association said that freezing temperatures throughout mid-September hit the country’s fruit growers with the coldest frost since 1929. Temperatures fell to an average of 19 degrees Fahrenheit for an average of seven hours in several of the Chile’s growing regions, contributing to a huge drop-off in fruit exports.

Chilean growers exported about 282 million boxes of fruit last year, and experts believe that exports will fall short of that by about 50 million boxes for this year. However, when production increases are taken into account, the total frost damage to fruit production could be closer to 60 million or 65 million boxes.

The wine industry was hit hard by the frost as well.

Estimates put the total damage to Chilean crops at $1 billion. Reuters reports that between 35 percent and 61 percent of stone fruit crops were damaged, 57 percent of almonds, 48 percent of kiwis and 20 percent of grapes. The U.S. imports about 42 percent of the country’s grapes.

“These frosts are the worst that agriculture has faced in 84 years, impacting the area from Coquimbo to Bio Bio,” the National Agricultural Society said.

Because of the lost production, fruit prices are expected to rise.

“All throughout November, December and January, prices of peaches, nectarines and plums will be higher because there will be shortages,” said Cristián Allendes, president of the Federation Fruit Producers. ”There will be half the volume of a normal year, so it is impossible for them to cost the same.”


The U.S. National Oceanic and Atmospheric Administration declared September 2013 to have tied with September 2003 as the fourth warmest on record. Global surface and oceanic temperatures were 1.15 degrees Fahrenheit above the 20th century average for that month.

However, September also brought with it record levels of arctic sea-ice coverage — only six years after the BBC reported that global warming would leave eliminate arctic sea ice by 2013.

Antarctica also experienced record levels of sea ice in September, with 7.51 million square miles surrounding the continent. This beat out the previous sea-ice coverage record, set in 2012. - Daily Caller.

Tuesday, October 15, 2013

Comet ISON expected to survive close Sun encounter

Via The Watchers

New studies released at the American Astronomical Society’s 45th Annual Division for Planetary Sciences meeting in Denver, Colorado suggests that Comet ISON could make it through its close perihelion passage near the Sun. Researchers Matthew Knight of the Lowell Observatory and Jian-Yang Li of the Planetary Science Institute presented their reasoning on Comet ISON observations on October 9, 2013.
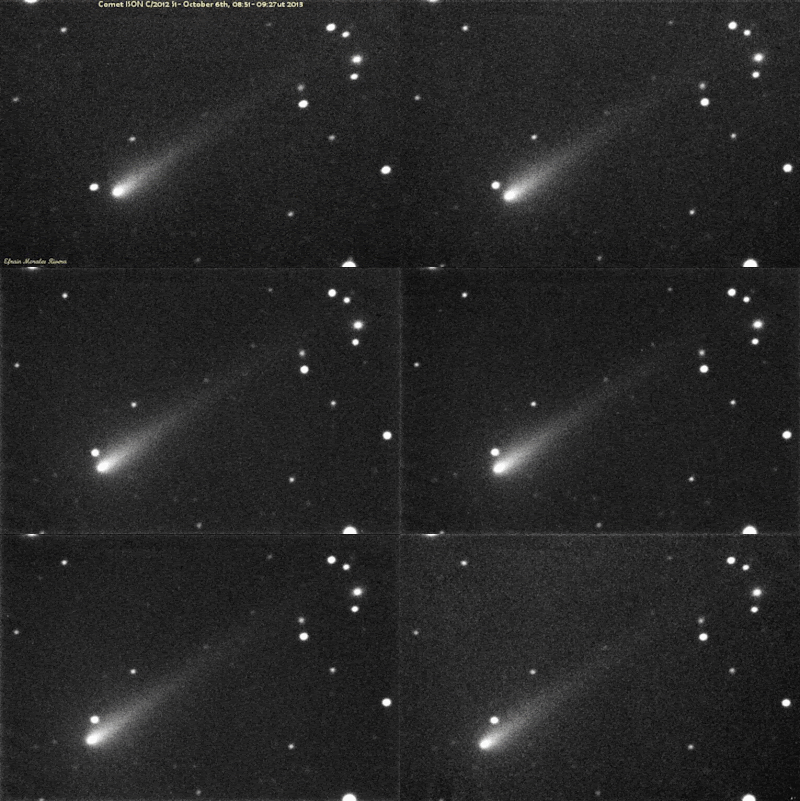
Animation shows Comet ISON on October 6, 2013 (Credit: Jaicoa Observatory)

The first criterion for ISON to survive perihelion is its nucleus size. Comet nuclei smaller than 200 meters in diameter, with an average density or lower typically do not survive a close passage to the Sun. Observations from the Hubble Space Telescope, as well as smaller telescopes, suggest that ISON is between 1 and 4 kilometers across. 

Researchers Kevin Walsh and Mathew Knight place the size of ISON’s nucleus in the range of 0.5 to 2 kilometers.Given current constraints on ISON's nucleus properties and the typically determined values for these properties among all comets, Walsh and Knight find tidal disruption to be unlikely unless other factors affect ISON substantially. Knight noted that ISON may be just big and dense enough not to be vaporized and to survive its close encounter with the Sun. So it looks like ISON appears likely to survive the combination of mass loss due to sublimation and tidal disruption for most plausible scenarios.

Table shows factors affecting comet's survivability. ISON's typical radius is about 1 km, density around 0.5 g cm3, axis ratio 1, rotation period 24 hr, and a random sense of rotation or retrograde as the preliminary results suggest (Credit: Walsh/Knight-Astrophysical Journal Letters)

Research scientist Jian-Yang Li of the Planetary Science Institute was able to infer the position and existence of a jet coming from the nucleus of the comet, which most likely marks the position of one of its rotational poles. Li noted that the previously observed red color in the coma of ISON suggests an already active comet sublimating water ice grains as they move away from the nucleus. 

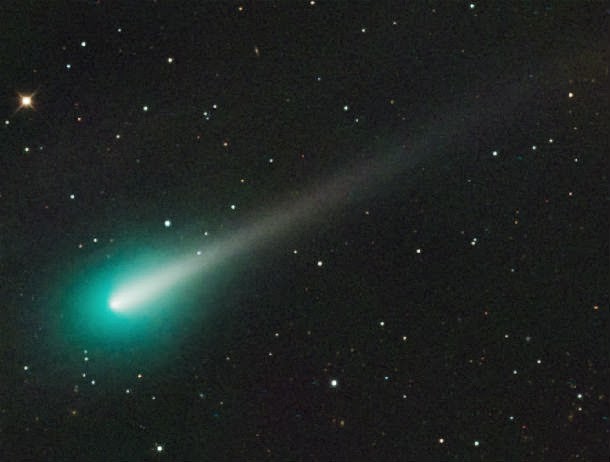
ISON's green color comes from the gases surrounding its icy nucleus. Jets spewing from the comet's core contain diatomic carbon and cyanogen. NASA's Swift mission observed a huge cloud of hydroxyl particles surrounding ISON. 

"Green" ISON observed ffrom Mount Lemmon, Arizona, US on October 8, 2013 (Credit: Adam Block/Mount Lemmon SkyCenter/University of Arizona)

The rotational pole of the nucleus indicates that only one side of the comet is being heating by the Sun on its way in until approximately one week before it reaches its closest point to the Sun. Prograde spin of an elongated nucleus may be a bad news for ISON, because tidal forces will very likely rip it apart. But a retrograde rotator is very likely to survive the encounter. 

Comet ISON as imaged from Aguadilla, Puerto Rico recently on October 6, 2013. (Credit: Efrain Morales Rivera)

ISON will pass inside the Roche limit of the Sun, which is a distance of 2.4 million kilometers with temperatures approaching 5,000 degrees Fahrenheit on closest approach. Comet ISON is expected to be the most active and put on its best showing post-perihelion - if it survives. 


Featured image credit: Adam Block/Mount Lemmon SkyCenter/University of Arizona

Monday, October 7, 2013

WEATHER PHENOMENON: Large Influx Of Electrons - Rare And Mysterious Red Auroras Spotted In The Skies Over Earth, Puzzling Experts!

October 04, 2013 - SPACE - On October 2nd, a CME hit Earth's magnetic field, sparking a G2-classgeomagnetic storm. Sky watchers on both ends of the Earth saw auroras; many of the lights were rare shades of red. Minoru Yoneto photographed this example from Queenstown, New Zealand: 


"This is how the sky looked 11 hours after the CME impact," says Yoneto, who used a Canon EOS 6D digital camera to record the reds.

Auroras are usually green, and sometimes purple, but seldom do sky watchers see this much red. Red auroras occur some 300 to 500 km above Earth's surface and are not yet fully understood. Some researchers believe the red lights are linked to a large influx of electrons. When low-energy electrons recombine with oxygen ions in the upper atmosphere, red photons are emitted. At present, space weather forecasters cannot predict when this will occur.

During the storm, even more red auroras were observed over the United States in places like Kansas, Ohio, and Oklahoma. Browse the gallery for examples. - Space Weather.

Friday, October 4, 2013

NASA confirms sun’s magnetic field is about to flip

The moment we have been waiting for...

Via nasa.gov, 5 August 2013 - Something big is about to happen on the sun.  According to measurements from NASA-supported observatories, the sun's vast magnetic field is about to flip.

"It looks like we're no more than 3 to 4 months away from a complete field reversal," says solar physicist Todd Hoeksema of Stanford University. "This change will have ripple effects throughout the solar system."

An artist's concept of the heliospheric current sheet, which becomes more wavy when the sun's magnetic field flips.

The sun's magnetic field changes polarity approximately every 11 years.  It happens at the peak of each solar cycle as the sun's inner magnetic dynamo re-organizes itself.  The coming reversal will mark the midpoint of Solar Cycle 24. Half of 'Solar Max' will be behind us, with half yet to come.

Hoeksema is the director of Stanford's Wilcox Solar Observatory, one of the few observatories in the world that monitor the sun's polar magnetic fields.  The poles are a herald of change. Just as Earth scientists watch our planet's polar regions for signs of climate change, solar physicists do the same thing for the sun. Magnetograms at Wilcox have been tracking the sun's polar magnetism since 1976, and they have recorded three grand reversals—with a fourth in the offing.


Solar physicist Phil Scherrer, also at Stanford, describes what happens: "The sun's polar magnetic fields weaken, go to zero, and then emerge again with the opposite polarity. This is a regular part of the solar cycle."

A reversal of the sun's magnetic field is, literally, a big event. The domain of the sun's magnetic influence (also known as the "heliosphere") extends billions of kilometers beyond Pluto. Changes to the field's polarity ripple all the way out to the Voyager probes, on the doorstep of interstellar space.

When solar physicists talk about solar field reversals, their conversation often centers on the "current sheet."

The current sheet is a sprawling surface jutting outward from the sun's equator where the sun's slowly-rotating magnetic field induces an electrical current.  The current itself is small, only one ten-billionth of an amp per square meter (0.0000000001 amps/m2), but there’s a lot of it: the amperage flows through a region 10,000 km thick and billions of kilometers wide.  Electrically speaking, the entire heliosphere is organized around this enormous sheet.

During field reversals, the current sheet becomes very wavy. Scherrer likens the undulations to the seams on a baseball.  As Earth orbits the sun, we dip in and out of the current sheet. Transitions from one side to another can stir up stormy space weather around our planet.

Cosmic rays are also affected. These are high-energy particles accelerated to nearly light speed by supernova explosions and other violent events in the galaxy.  Cosmic rays are a danger to astronauts and space probes, and some researchers say they might affect the cloudiness and climate of Earth. The current sheet acts as a barrier to cosmic rays, deflecting them as they attempt to penetrate the inner solar system. A wavy, crinkly sheet acts as a better shield against these energetic particles from deep space.

As the field reversal approaches, data from Wilcox show that the sun's two hemispheres are out of synch.
"The sun's north pole has already changed sign, while the south pole is racing to catch up," says Scherrer. "Soon, however, both poles will be reversed, and the second half of Solar Max will be underway."
When that happens, Hoeksema and Scherrer will share the news with their colleagues and the public.

Thursday, October 3, 2013

Six years of observing the Earth's magnetosphere

By Adonai via The Watchers, 27 September 2013


There is still only a handful of spacecraft to watch for solar and magnetic storms but the number of observatories has been growing over the last six years. Today, these spacecraft have begun to provide the first multipoint measurements to better understand space weather events as they move through space, something impossible to track with a single spacecraft.


Helping to anchor that team of spacecraft is a NASA mission called THEMIS (Time History of Events and Macroscale Interactions during Substorms). THEMIS was launched on February 17, 2007, with five nearly identical spacecraft nestled inside a Delta II rocket. Over time, each spacecraft moved into formation to fly around Earth in a highly-elliptical orbit that would have them travelling through all parts of Earth's space weather environment, a giant magnetic bubble called the magnetosphere. With five different observatories, scientists could watch space weather unfold in a way never before possible.


"Scientists have been trying to understand what drives changes in the magnetosphere since the 1958 discovery by James Van Allen that Earth was surrounded by rings of radiation," says David Sibeck, project scientist for THEMIS at NASA's Goddard Space Flight Center in Greenbelt, Md. "Over the last six years, in conjunction with other key missions such as Cluster and the recently launched Van Allen Probes to study the radiation belts, THEMIS has dramatically improved our understanding of the magnetosphere."

Since that 1958 discovery, observations of the radiation belts and near Earth space have shown that in response to different kinds of activity on the Sun, energetic particles can appear almost instantaneously around Earth, while in other cases they can be wiped out completely. Electromagnetic waves course through the area too, kicking particles along, pushing them ever faster, or dumping them into the Earth's atmosphere. The bare bones of how particles and waves interact have been described, but with only one spacecraft traveling through a given area at a time, it's impossible to discern what causes the observed changes during any given event.

"Trying to understand this very complex system over the last 40 years has been quite difficult," says Vassilis Angelopoulos, the principal investigator for THEMIS at the University of California in Los Angeles (UCLA). "But very recently we have learned how even small variations in the solar wind – which buffets Earth's space environment at a million miles an hour - can sometimes cause extreme responses, causing more particles to arrive or to be lost."

An artist's concept of the THEMIS spacecraft orbiting around Earth. Credit: NASA

Understanding the changes energy from the Sun undergoes as it travels away and out into space is crucial for scientists to achieve their goal of some day predicting the onset of space weather that creates effects such as the shimmering lights of the aurora or interruptions in radio communications at Earth.

Taking advantage of an unprecedented alignment of eight satellites through the vast magnetic environment that surrounds Earth in space, including NASA’s ARTEMIS and THEMIS, scientists now have comprehensive details of the energy’s journey through a process that forms the aurora, called a substorm. Their results, published in the journal Science on September 27, 2013, showed that small events unfolding over the course of a millisecond can result in energy flows that last up to half an hour and cover an area 10 times larger than Earth.

Trying to understand how gigantic explosions on the Sun can create space weather effects involves tracking energy from the original event all the way to Earth. It’s not unlike keeping tabs on a character in a play with many costume changes, because the energy changes form frequently along its journey: magnetic energy causes eruptions that lead to kinetic energy as particles hurtle away, or thermal energy as the particles heat up. Near Earth, the energy can change through all these various forms once again.

Most of the large and small features of substorms take place largely in the portion of Earth’s magnetic environment called the magnetotail. Earth sits inside a large magnetic bubble called the magnetosphere. As Earth orbits around the Sun, the solar wind from the Sun streams past the bubble, stretching it outward into a teardrop. The magnetotail is the long point of the teardrop trailing out to more than 1 million miles on the night side of Earth. The Moon orbits Earth much closer, some 386 000 km (240 000 miles) away, crossing in and out of the magnetotail.

On July 3, 2012, eight spacecraft were lined up on the night side of Earth, enabling scientists to track how magnetic energy from the Sun moved around Earth, reconnected at a point about half way to the moon, and then spread through the back end of Earth’s magnetic environment, the magnetotail. Image credit: NASA/SVS


This short video features commentary by David Sibeck, project scientist for the THEMIS mission, discussing a visualization of reconnection fronts.

Magnetic reconnection

“It’s a meticulous accounting job,” says Angelopoulos. “With all these spacecraft measuring what’s going on continuously throughout the system, we can track the total energy and see where and when it’s converted into different kinds of energy. And the effort paid off handsomely!”

Scientists have observed much of the energy’s journey through a substorm before. When the solar wind streams off the Sun it can connect with the front of Earth’s magnetosphere. As the two sets of magnetic fields come together, a process called magnetic reconnection turns the energy of the forward-moving solar wind into an explosion that sends particles and magnetic fields moving around the planet to the far side of Earth. Here, the fields reconnect again creating a burst that turns magnetic energy into acceleration of particles and heating. Just where and how this energy converted to particle movement, however, has been unclear.

The details of what happened next required observations from many spacecraft simultaneously. While the magnetic reconnection event itself happened in a specific place somewhere halfway between Earth and moon’s orbit in a region just a couple hundreds of miles across, this is not the main place where the energy was converted. Regions, labeled as “reconnection fronts” in the paper, surged away from the original reconnection point -- one propagated toward Earth and one moved away, past the moon and down the magnetotail. These fronts are like sheets of current, a wall hurtling in each direction, continuing to convert energy for up to 30 minutes afterward. The energy moving in toward Earth helps to create the aurora and it also funnels into the giant donuts of radiation around Earth called the radiation belts.

“The amount of power being converted is comparable to the electric power generation on Earth from all sources at any moment in time. And it happens over 30 minutes,” says Angelopoulos. “The amount of energy released is equivalent to a 7.1 Richter scale earthquake.”

The fact that this energy can move around so dramatically is not in and of itself surprising. Scientists have certainly previously suggested such things based on computer models. But it is only with a fleet of spacecraft that scientists can confirm the location and exact nature of the process, not to mention learning something new such as how continuous and long term the energy conversion process is after the initial magnetic reconnection event.

In late 2014, NASA will add a new mission to their Heliophysics fleet. The Magnetospheric Multiscale or MMS mission will put spacecraft directly in the magnetic reconnection areas on both the day- and night-sides of Earth.


“Understanding where to look for the energy conversion, opens up a new window for research,” says Sibeck. “MMS will be focusing on tracking just this kind of observation.”

The light from the aurora is caused by charged particles (mostly electrons) that come from inside the magnetosphere and then speed up to very high speeds as they barrel down along magnetic field-lines into the upper atmosphere. As they collide with the gas, they excite the atoms and molecules, which emit light when they relax from their excited state. Credit: UC Regents


The culprit behind aurora is our own Sun and the solar plasma that is ejected during a magnetic event like a flare or a coronal mass ejection.


This video is included here just because it has the best aurora images taken from space.

In its sixth year in space, scientific papers using THEMIS data helped highlight a number of crucial details about what causes space weather events in this complex system.

THEMIS has now traveled through more than 50 solar storms that caused particles in the outer radiation belts to either increase or decrease in number. Historically, it has been difficult for scientists to find commonalities between such occurrences and discover what, if anything consistently caused an enhancement or a depletion.

With so many events to study, however, and a more global view of the system from several spacecraft working together – including, in this case, ground based observations and NOAA's GOES (Geostationary Operational Environment Satellites) and POES (Polar Operational Environmental Satellites) data in addition to THEMIS data – a team of scientists led by Drew Turner at UCLA could better characterize what processes caused which results.

Turner's group recently presented evidence linking specific kinds of electromagnetic waves in space – waves that are differentiated based on such things as their frequencies, whether they interact with ions or electrons, and whether they move along or across the background magnetic fields – to different effects. Chorus waves, so called because when played through an amplifier they sound like a chorus of singing birds, consistently sped up particles, leading to an increase in particle density. On the other hand, two types of waves known as hiss and EMIC (Electromagnetic Ion Cyclotron) waves occurred in those storms that showed particle depletion. Turner also observed that when incoming activity from the Sun severely pushed in the boundaries of the magnetosphere this, too, led to particle drop outs, or sudden losses throughout the system. Such information is helpful to those attempting to forecast changes in the radiation belts, which if they swell too much can encompass many of our spacecraft.

Another group has a paper in print in 2013 based on 2008 data from the five THEMIS spacecraft in conjunction with three of NOAA's GOES (Geostationary Operational Environmental Satellites) spacecraft, and the ESA/NASA Cluster mission. Led by Michael Hartinger at the University of Michigan in Ann Arbor, this group compared observations at the bow shock where the supersonic solar wind brakes to flow around the magnetosphere to what happens inside the magnetosphere. They found that instabilities drive perturbations in the solar wind particles streaming towards the bow shock and that these perturbations can be correlated with another type of magnetized wave – ULF (ultra low frequency) waves - inside the magnetosphere. ULF waves, in turn, are thought to be important for changes in the radiation belts.

"The interesting thing about this paper is that it shows how the magnetosphere actually gets quite a bit of energy from the solar wind, even by seemingly innocuous rotations in the magnetic field," says Angelopoulos. "People hadn't realized that you could get waves from these types of events, but there was a one-to-one correspondence. One THEMIS spacecraft saw an instability at the bow shock and another THEMIS spacecraft then saw the waves closer to Earth."

A third interesting science paper from THEMIS's sixth year focused on features originating even further upstream in the solar wind. Led by Galina Korotova at IZMIRAN in Troitsk, Russia, this work made use of THEMIS and GOES data to observe the magnetosphere boundary, the magnetopause. The researchers addressed how seemingly small perturbations in the solar wind can have large effects near Earth. Wave-particle interactions in the solar wind in the turbulent region upstream from the bow shock act as a gate valve, dramatically changing the bow shock orientation and strength directly in front of Earth, an area that depends critically on the magnetic field orientation. The extreme bow shock variations cause undulations throughout the magnetopause, which, launch pressure perturbations that may in turn energize particles in the Van Allen radiation belts.

Understanding Earth's magnetosphere is a work in progress and all of this recent work helps illuminate the nitty gritty details of how seemingly small changes in a system can lead to large variations in the near-Earth space environment.